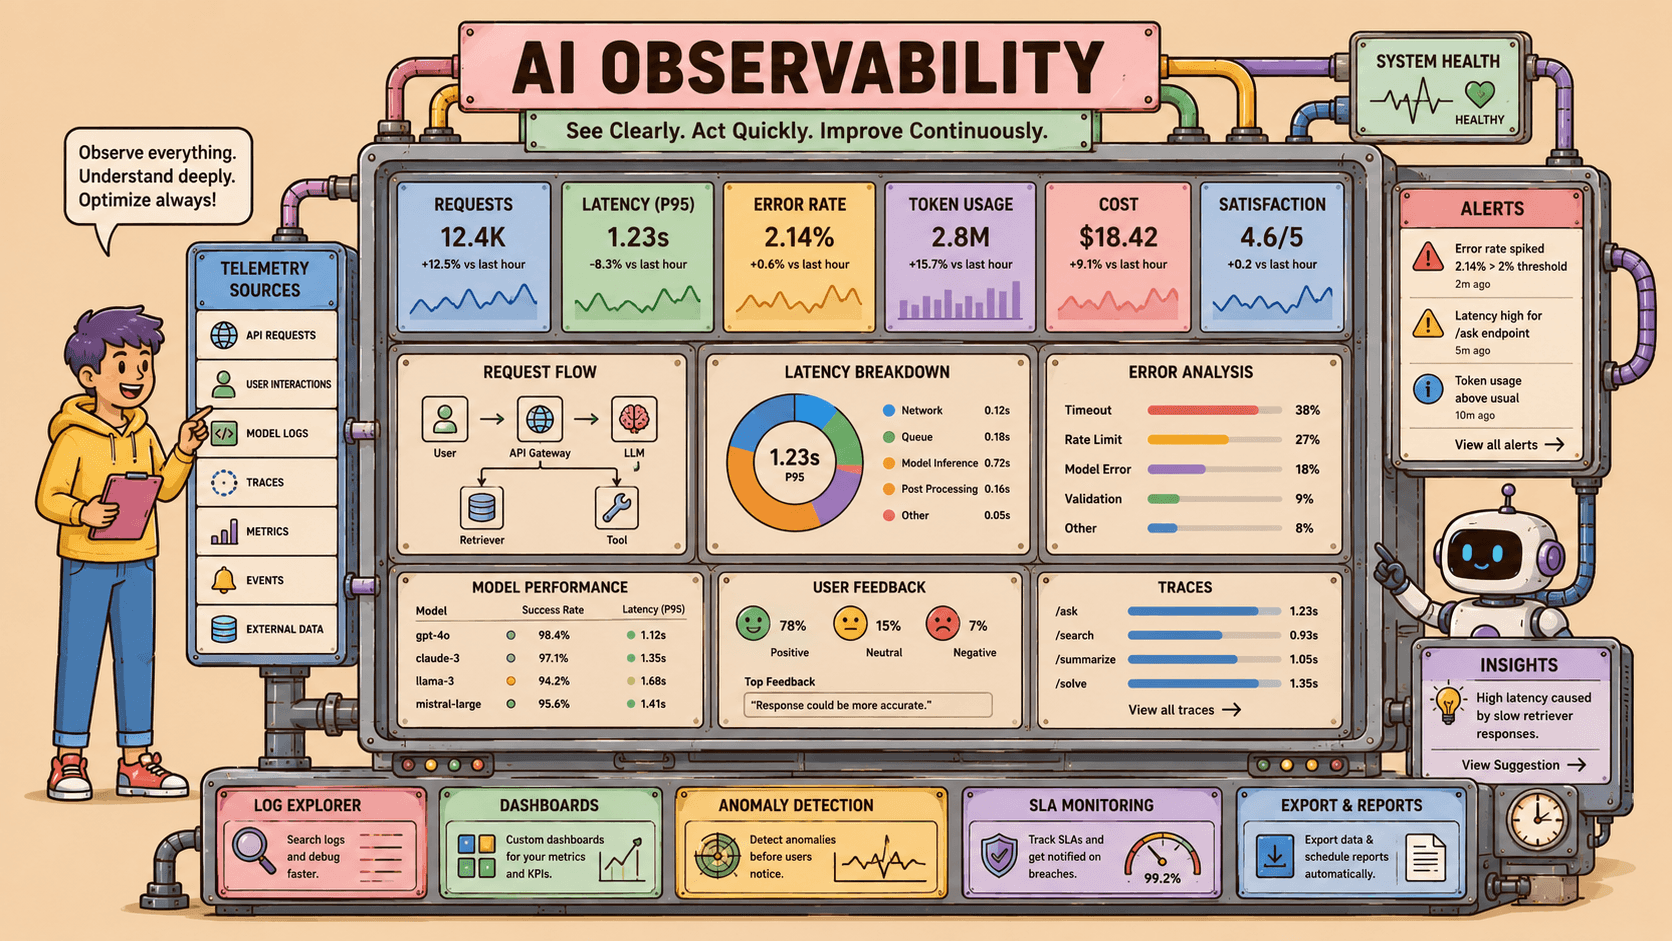
I need traces for every generation and tool call — latency, errors, and user impact — or I'm flying blind in production.
In my daily workflow
- I check Sentry for new AI route errors after deploys.
- PostHog shows assistant usage, drop-off, and feature adoption.
- I correlate model version changes with error rate and satisfaction proxies.
- I add breadcrumbs when introducing new tools or graph nodes.
How it makes me work smarter
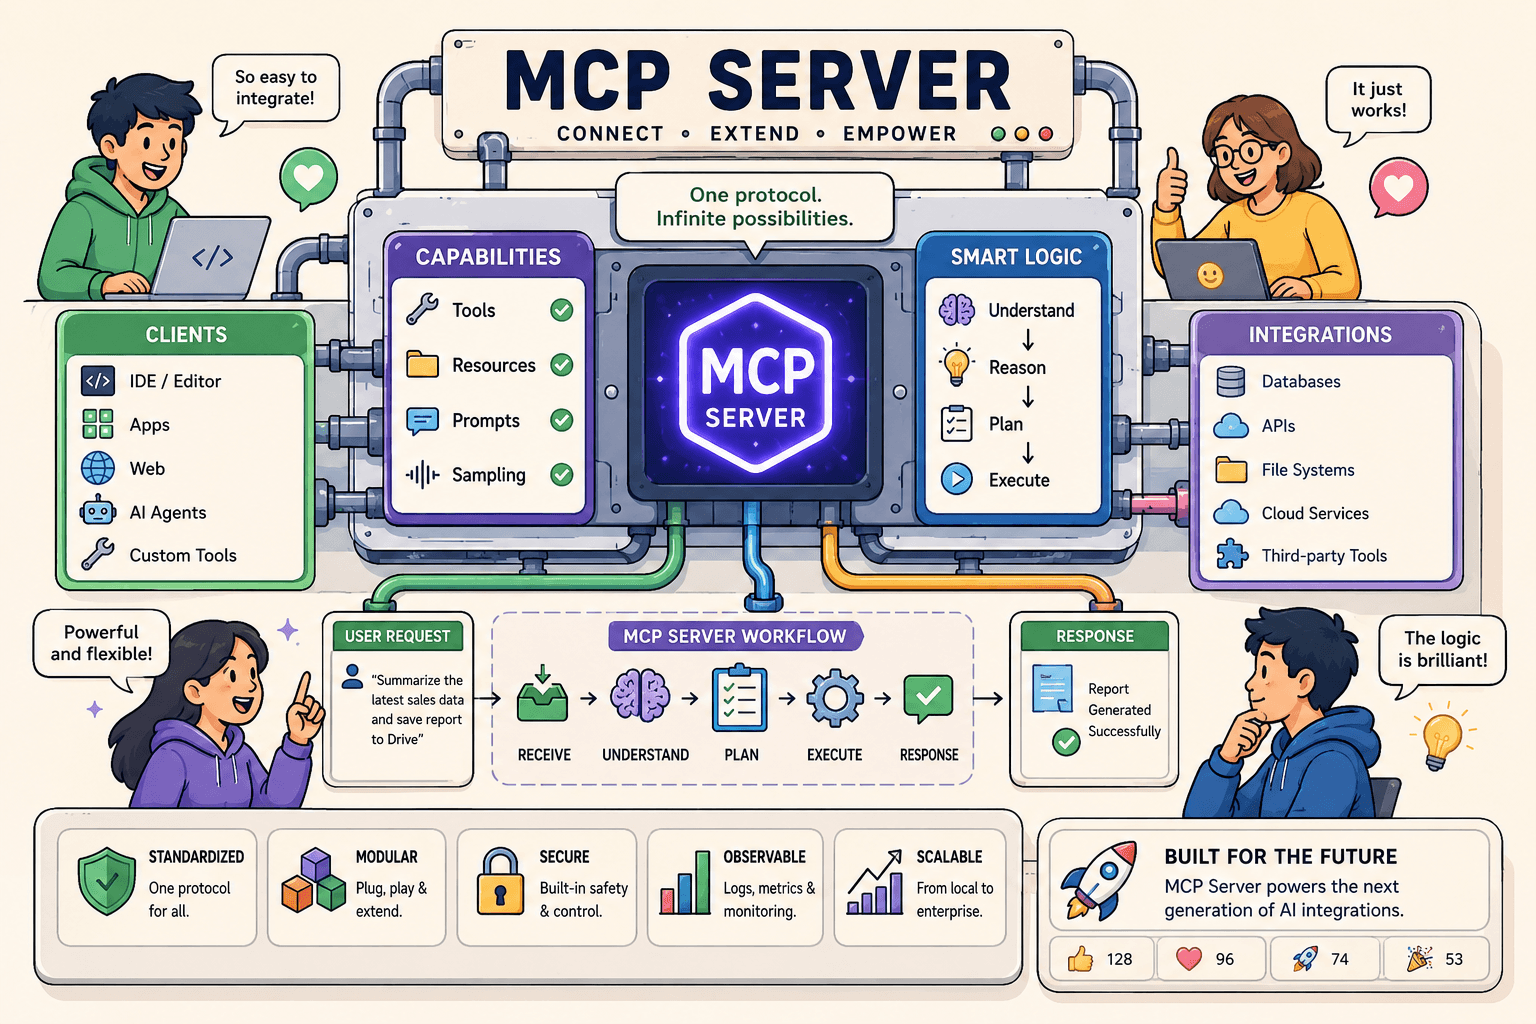
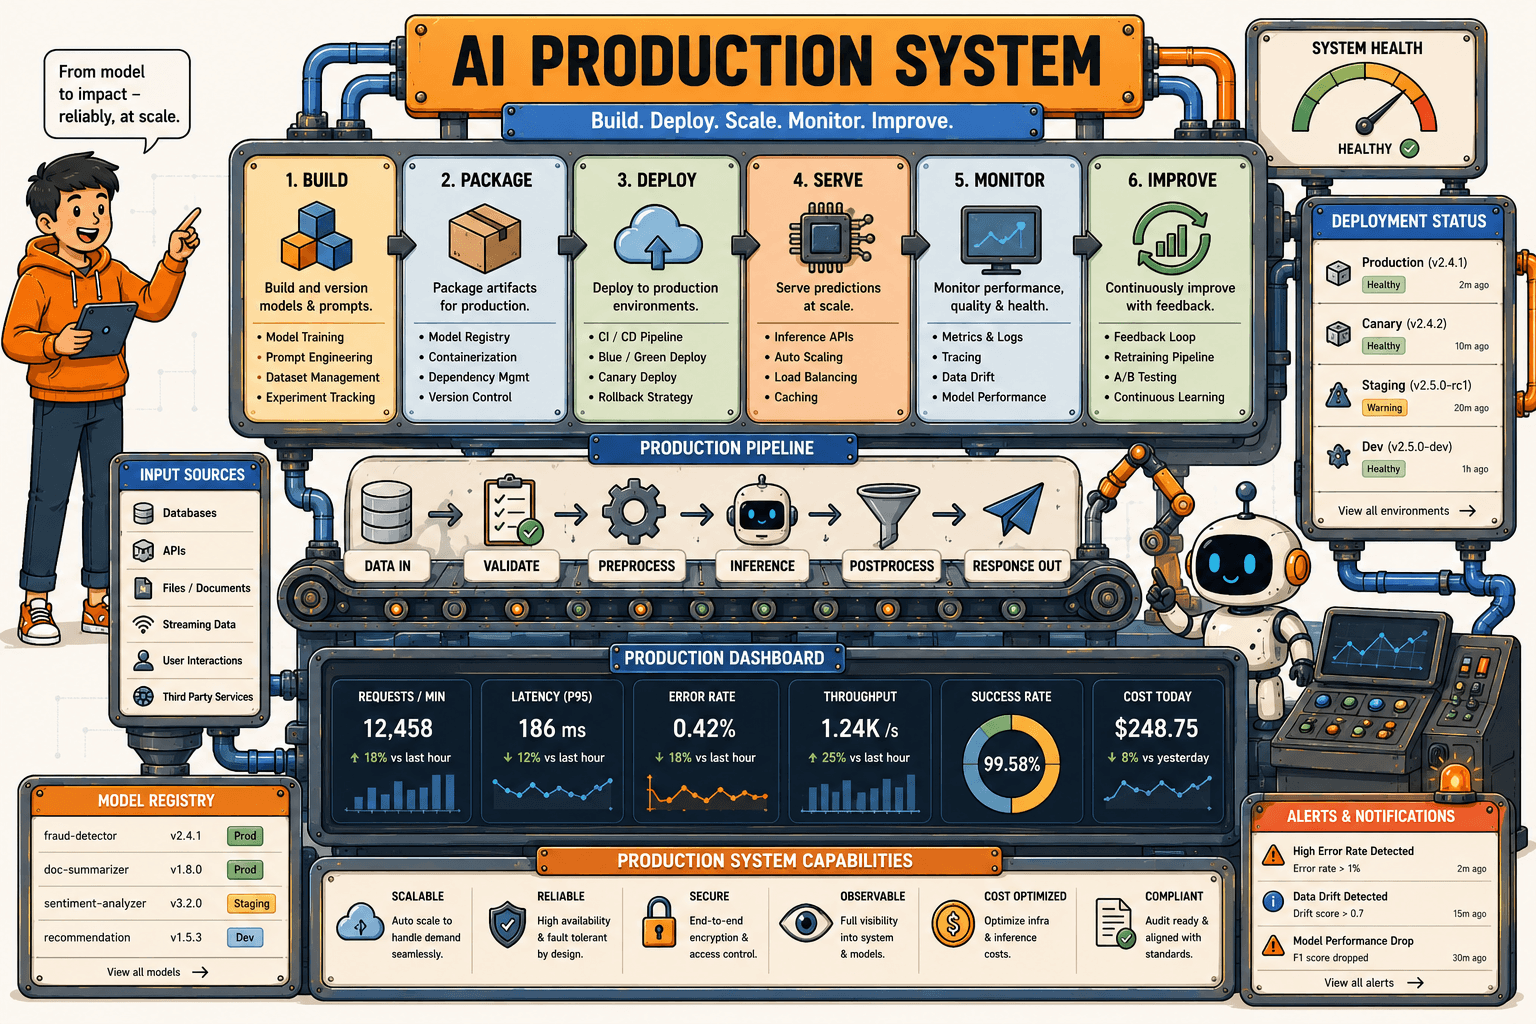
Observability turns 'the assistant feels worse' into 'retrieval timeout up 40% on /api/assistant'. I fix root causes instead of tweaking prompts randomly. MCP makes this faster — query PostHog and Sentry from the IDE during incident response.
My setup
- Sentry for exceptions and performance on API routes
- PostHog events for assistant, copilot, and gallery engagement
- Structured logs with request IDs across graph nodes
- MCP integrations for querying analytics from Cursor
On this portfolio
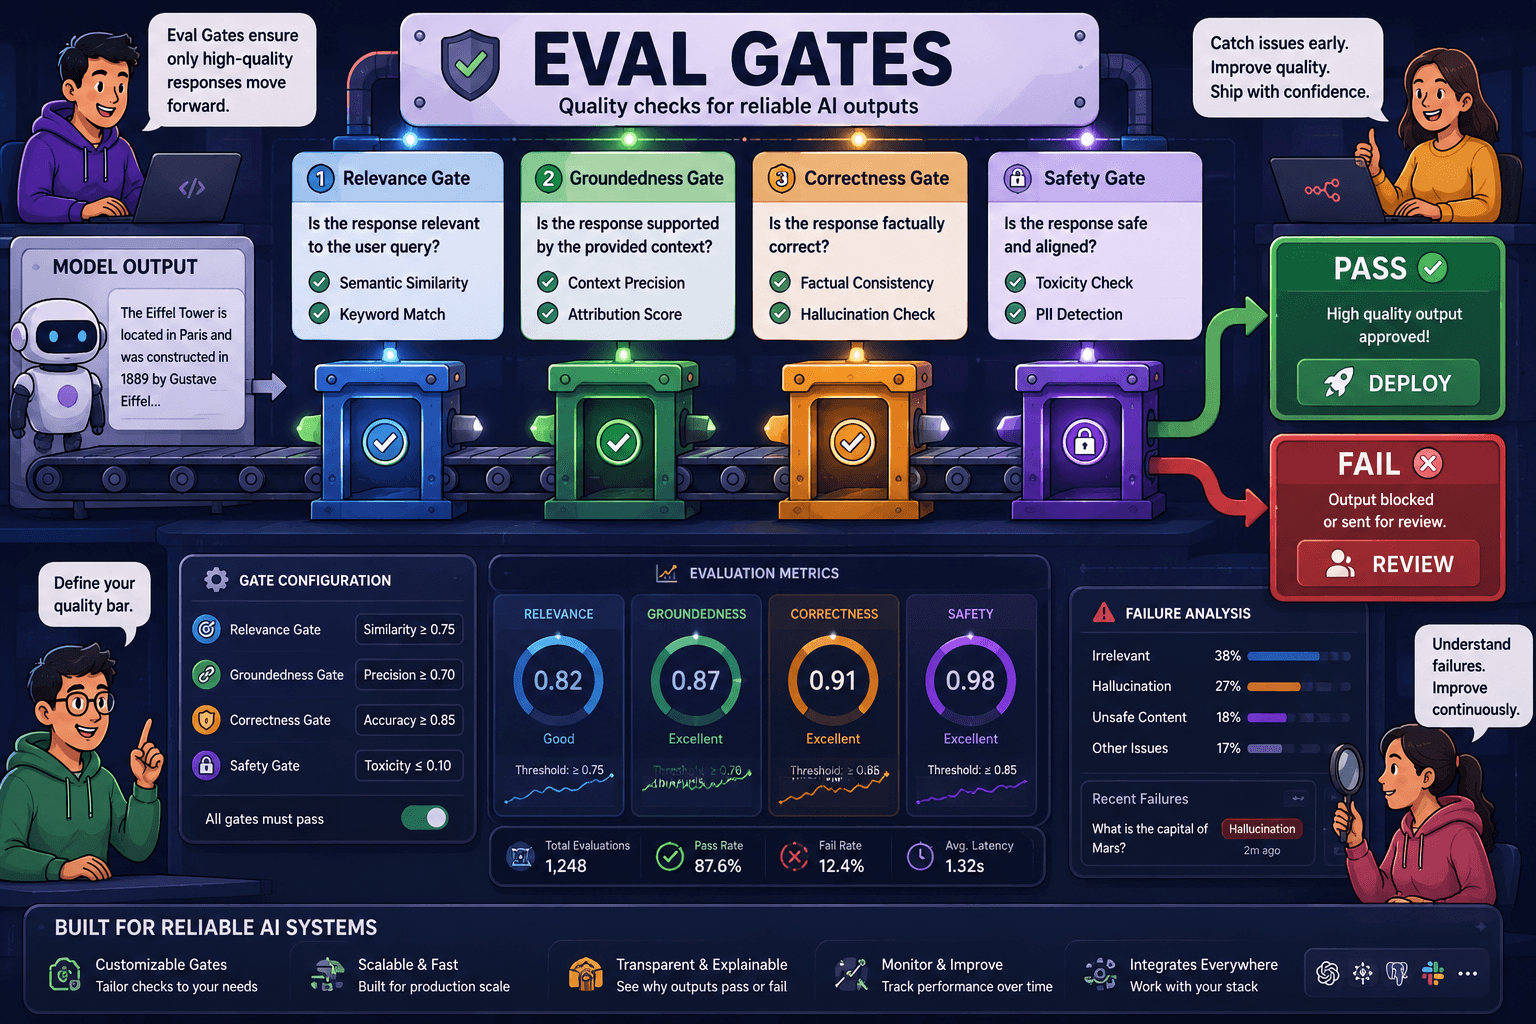
Assistant feedback API feeds PostHog; Sentry captures server failures in copilot and knowledge routes. Admin job-fit analytics aggregates classifier outcomes — closing the loop from production behavior to eval improvements.